
How Product Images Drive Return Rates
Conversion measures whether an image persuaded. Returns measure whether it was accurate. Optimizing only on the first selects for images that overpromise.
Every other measure of product imagery is a matter of opinion. Whether a photograph looks good, feels on brand, or represents the product well are all judgments, and judgments about images do not converge.
Returns are not a judgment. A customer received the thing and sent it back, and somewhere in that decision is information about what the images promised.
Conversion and returns measure different things
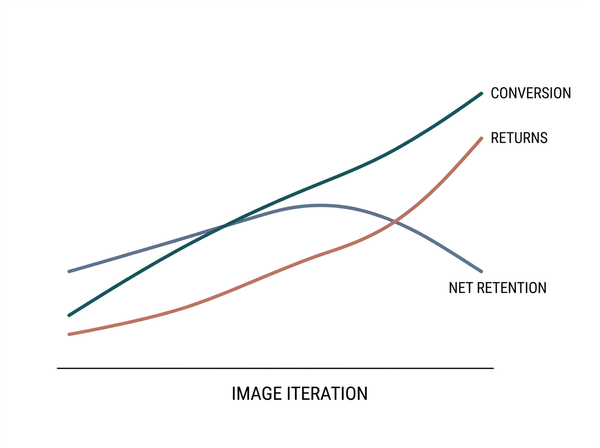
Conversion measures whether an image persuaded someone. Returns measure whether it was accurate. Those are separate properties and they can move in opposite directions.
An image that overpromises does both at once. More people buy, because the product looks better than it is, and more of them send it back, because it is not what they saw. The conversion figure improves and the business is worse off.
Which means a team optimizing on conversion alone is running a selection process for images that mislead. Not deliberately — nobody chooses the misleading version. The process chooses it, because it is the version that performs on the measure being watched, and the cost lands somewhere nobody is looking.
This is the single strongest argument for treating returns as an image metric rather than as a logistics number.
The direction of the bias is worth naming plainly, because it matches a pattern that runs through every part of image production: errors accumulate on the flattering side. Nobody rejects an image for making a product look better than it is, so the versions that survive review are consistently the ones that promise slightly more. Returns are where that accumulated flattery is finally counted.
Most returns are not image problems
Before the metric is usable, it has to be separated.
Returns arrive for reasons that split into roughly six categories: the size was wrong, the item did not look like the customer expected, the quality was not what they expected, they changed their mind, the wrong item was sent, or it arrived damaged.
Only two of those are addressable by imagery, and one only partly. Appearance mismatch is squarely an image problem. Quality disappointment is partly one, since images can suggest a material that the product does not have.
Size returns mostly are not. An image settles appearance rather than fit, so a customer returning something because it did not fit is reporting a failure of measurement information rather than of photography. Better images will not move that number, and attributing it to imagery leads a team to spend on the wrong thing.
So the figure to watch is not the return rate. It is the share of returns citing appearance, and its movement over time.
Return reasons are self-reported and lossy
That share is only as good as the categories customers choose from.
Return reason dropdowns are typically designed for operations — routing, restocking, refund policy — rather than for diagnosis. They tend to include a broad option meaning something like “did not like it,” and broad options absorb everything. A customer who is mildly disappointed and does not want to explain will pick it, whatever their actual reason.
Making the metric usable therefore starts before any image changes: the categories have to distinguish the things you want to tell apart. At minimum, appearance needs to be separable from fit, and within appearance it helps to separate color from everything else, since color is the most common specific complaint and the most directly fixable.
Where the categories cannot be changed — and on many platforms they cannot — free-text comments are the fallback. They are unstructured and they contain the actual reason, which the dropdown frequently does not.
Attribution works per change, not per return
No individual return can be attributed to an image. The customer had many reasons, remembers few of them, and reported one.
What can be attributed is a change. Alter the imagery for one product, leave everything else alone, and watch that product’s own return rate against its own history. The product acts as its own control, which removes the differences between products that make cross-product comparison unreliable.
Comparing two different products with different imagery tells you very little, because the products differ in price, category, fit, and popularity, and any of those affects returns more than imagery does. Within-product before and after is the only comparison that isolates the variable.
That is also why this work proceeds slowly. Each change tests one product, and the answer takes as long as the return window plus enough volume to see a difference.
The feedback arrives too late for a weekly cycle
Returns lag purchases by weeks. A customer buys, waits for delivery, considers, and eventually decides.
Conversion, by contrast, is visible immediately. Which produces a structural bias in how imagery gets optimized: teams working on a weekly or fortnightly cadence can only respond to the fast signal, and the fast signal is the one that rewards overpromising.
Any process that reviews imagery performance more often than returns arrive is, by construction, optimizing on conversion alone. Recognizing that is most of the fix — the review cadence for imagery has to match the return window rather than the analytics dashboard.
What to change when appearance returns rise
• Color accuracy first, since it is the most frequent specific complaint and the most objectively checkable.
• Scale, if customers report the item being larger or smaller than expected, which usually means no reference in the frame rather than a wrong dimension in the copy.
• Texture and material legibility, which is what detail imagery exists to carry and what a compressed or over-retouched image loses first.
• A missing view, since a return citing something the customer “did not expect” often points at a property no image showed.
Each of these corresponds to a claim the image set failed to make. Working through them in that order is more productive than reshooting everything, since the first two account for a large share of appearance returns and are the cheapest to correct.
Returns as a page-level signal
Return reasons also say something about the page rather than about individual images.
A cluster of appearance returns on one product with good individual images usually means the set is incomplete — the images are each accurate and collectively fail to answer a question, so the customer filled the gap with an assumption. That is a structural problem in how the page assigns claims to images rather than a quality problem in any photograph.
The distinction matters for what gets commissioned. An incomplete set needs an additional image, which is cheap. A misleading set needs the existing images corrected, which is expensive and slower.
Telling them apart before commissioning anything is worth the hour it takes. List the claims the page makes and the claims a customer needs, and see whether the gap is a missing claim or a wrong one. A missing claim is an addition; a wrong one is a correction, and confusing the two is how a reshoot gets approved for a problem that a single extra frame would have solved.
What return rate cannot tell you
The metric has one blind spot, and it is large.
It says nothing about customers who did not buy because the images undersold the product. That failure produces no return, no complaint, and no record — it produces nothing at all, which is why it never enters any discussion about imagery.
So returns are the honest metric for accuracy in one direction only. A page whose images consistently understate the product will show excellent return figures and be losing money quietly, and no amount of attention to returns will surface it.
That is the argument for not optimizing on returns alone either. The pair of numbers together — how many people bought, and how many kept it — carries information that neither carries on its own.
FAQ
What return rate should we be aiming for?
There is no useful general figure, since returns vary enormously by category, price point, market, and return policy. The number worth watching is your own, over time, on products where imagery changed and nothing else did.
How long should we wait before judging a change?
At least one full return window plus enough sales volume that the difference is not noise. For most products that is considerably longer than teams want to wait, which is the main reason this work gets skipped.
Can we use returns data to justify imagery spend?
It is the only imagery measure that arrives in a form finance recognizes, which makes it the right one to build a case with. The case is stronger when it covers a small number of products measured properly than a general claim about image quality.
What if our platform does not let us change return reasons?
Free-text comments contain what the dropdown does not, and reading a sample of them by hand is more informative than it sounds. A few dozen read carefully will tell you which category is being absorbed by the broad option.
Do returns differ between marketplace and own-site sales?
Often considerably, since the policies, the customer expectations, and the image standards all differ. Comparing across channels is another cross-comparison that does not isolate imagery.
Should high-return products get imagery attention first?
Products where appearance returns are high and rising, specifically. A product with high returns for fit reasons will not respond to better imagery, and starting there produces an expensive result that changes nothing.
Where this leaves you
Split your returns by reason before drawing any conclusion about imagery.
The total tells you almost nothing, because most of it is fit, logistics, and changed minds. The appearance share is the part your images can move, and watching it product by product across a change is the only method that isolates the variable. It is slow, it lags, and it is the one measure of product photography that is not a matter of opinion.
Split the number before you use it
Pull your returns for one quarter and separate them by stated reason. Whatever share cites appearance is the part imagery can address; everything else will not respond to better photographs however much is spent on them. Then pick one product in that share, change one thing about its images, and wait a full return window before deciding. Slow, unglamorous, and the only version of this that produces an answer you can act on. See how product page image sets are structured.
→ https://www.style3d.ai/ai-photoshoot/ai-fashion-pdp-layout
Written by